HiperEdge
HiperEdge solves several problems associated with analyzing information using graph analytics:
- We can connect Nodes using Edges between them (if they are directly connected).
- We can recursively connect Nodes with distant Nodes if they share the same Edge Type .
- We need to know the ontology of the graph if the connections are not direct or more complex.
- There might be multiple paths between Nodes and need to aggregate them together.
This normally involves employing a data-analyst to the build (and maintain) queries using information they discover about relationships, or we duplicate edges to include all trace relationships to avoid the need for complex queries. The problem with duplicating relationships is that our standard graph views end up looking like spider-webs of overlayed relationships. HiperEdge addresses this problem by finding the path only when needed by searching through the path of connections using a Route map, recursively using parallel search: HiperEdge queries are fast enough there is no benefit from storing them.
Each Node has a number of functions called HiperEdges (and HiperEdgesAsync) to retrieve the set of HiperEdge associated with this Node:
HiperEdges (TypeName, length, target): treat an edge as being transitive to retrieve an entire graph of nodes through a single edge type (e.g. HiperEdges("Child") for a descendants), up to an optional maximum length to an optional Node type.
HiperEdges (HiperName, TypeName list, length, target): project a HiperEdge type using the path through any of the TypeName in the list (e.g. HiperEdges("Ancestor", new[] {"Father","Mother") for Ancestors optionally all the way to Eve)
HiperEdges (HiperName, Rule set, length, target): project the set of
HiperEdgeusing the set of Rule triples From Type, Edge Type, To Type} for the path from Node to related Node. This case needs an example to explain why it might be needed.
Enterprise Architecture Sample
The diagram represents an aspect of a company’s enterprise architecture, modelled using the TOGAF model and Archimate notation.
The model includes "Happy Customers" goal, and all the related {Course-of-Action, Capability, Function, Process/Activity, Actors, Events, Services, and Systems} items involved in achieving the goal.
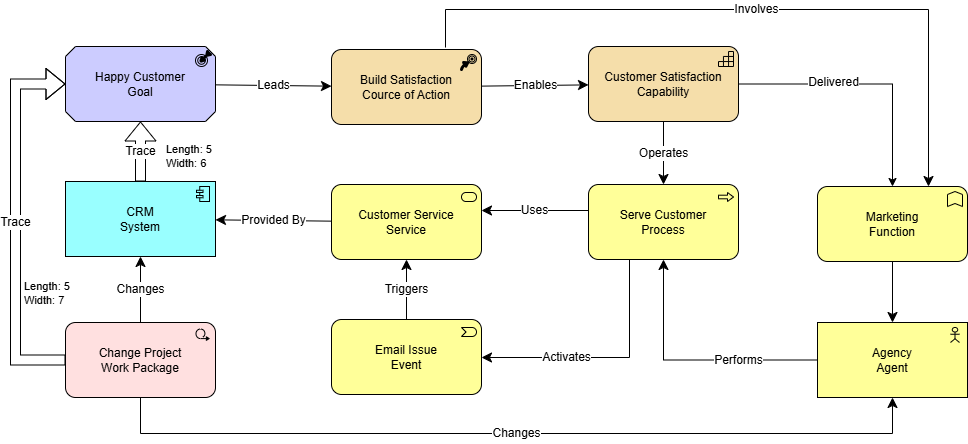
TOGAF is a complex model where there are significant defined associations, but could also include anecdotal connections {Principles, Constraints, Assumptions, Location, Gaps} that are descriptive, but not significant when relating Nodes together. In addition, Function is a hierarchy, where any level of a taxonomy could be associated with a Process/Activity.
The model is complex because there are multiples paths that could links a Goal to a System, including:
- Goal -> Course-of-Action -> Capability -> Process/Activity -> Service -> System.
- Goal -> Course-of-Action -> Capability -> Process/Activity -> Event (email) -> Service -> System.
- Goal -> Course-of-Action -> Capability -> Function -> Actor -> Process/Activity -> Service -> System.
- Goal -> Course-of-Action -> Capability -> Function -> Actor -> Process/Activity -> Event -> Service -> System.
- Goal -> Course-of-Action -> Function -> Actor -> Process/Activity -> Service -> System.
- Goal -> Course-of-Action -> Function -> Actor -> Process/Activity -> Event -> Service -> System.
The broad arrow Trace highlights the derivied HiperEdge that we're looking to understand linking the CRM system and Change Project to the goal Happy Customer. From the paths we can see that
- "CRM" => "Happy Customer" has a width of 6 (different paths connecting them) and length 5 (shortest path between them)
- "Change Project" => "Happy Customer" has a width of 7 (as above, but additional connection to agency) and length 4 (shortest path between them)
In this case Change Project adds functionality to the CRM system, to replace manual activities performed by an expensive and slow outsourced agency.
This type of problem requires the use of Rule set to return the HiperEdge set we're interested in without the noise of descriptive associations. This is such a common problem that the TOGAF sample includes a Goal extent property for all the goals associated with a Work Package (example).
To construct the equivalent query using a graph query language would be extremely complex, but it is not an academic problem, since it helps us answer questions:
- Which Projects are most closely associated with my strategic goals?
- Of the strategic projects, which contributes most to my goals?
- Of the strategic projects, which reduces most operating cost (Cost reduction goal is not shown, but every enterprise has one)?
Implementation
A HiperEdge contains an Edge and optionally a reference to the source HiperEdge that it extended. For the Above Ea diagram, the Trace HiperEdge
{ CRM System ->Trace -> Happy Customer } contains Edge that is being extended and the source HiperEdge that it extends from
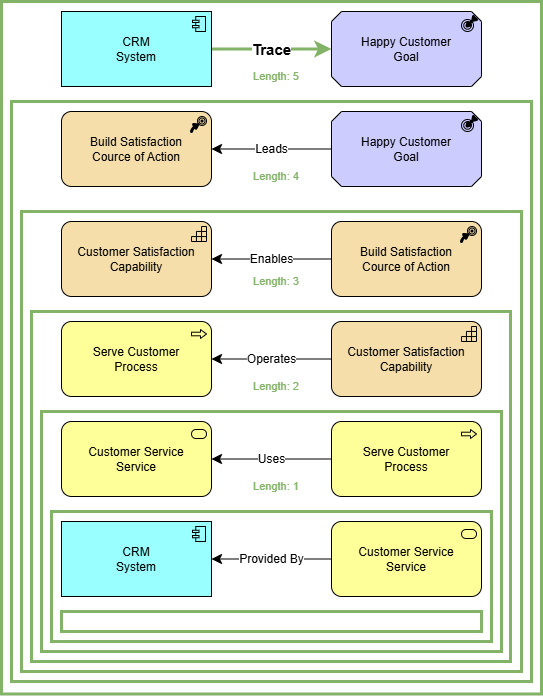
The graph can be viewed as a butterfly view displaying only the HiperEdge, or recursively unpacking each HiperEdge to retrieve the full end-to-end graph of edges. Note the HiperEdge only includes the shortest path from start to end and not the alternative paths that could be followed.
Cost derivative
Calculating Cost is not provided by the "Project -> Goal" HiperEdge, but this can be calculated by joining
- The
HiperEdgeset all elements that have a "trace" association to "Project" - The
HiperEdgeset all elements that have a "trace" association from "Happy Customers"
From the inner join, we can extract {Cost of Time, Cost of Usage, Time spent} properties of each element and aggregate to get the relative cost and benefit of each project.
Because HiperEdge is processed in parallel and recursively (to eliminate loops), it is realistic to perform every time it is needed.
Hiperspace.DB
Hiperspace.DB provides a server that extends this usage in a number of ways
- Multi-user access with access control.
- Cube aggregation, that tracks history
- ODATA source for access directly from Business Intelligence tools.
- SQL service for dataflows to traditional warehouse stores.
- Graph View that displays the graph as a SVG diagram, with navigation to elements and cube aggregates
- Butterfly graphs that use pre-defined
HiperEdge Rulesto see summary graphs that hide all the intermediate nodes within a path.
The name "Butterfly" is used because, once it is possible to hide the path details, Leaders will view the output as the Butterfly effect of action -> effect without the consideration for all the possible ways they are connected.
Hiperspace provides a rich and efficient graph model without duplication (e.g. "Child" is not a storedEdge but derived from the fact that a Person has a "Mother" and "Father"). Another interesting aspect arises that extremely complex graph queries can be expressed directly using SQL without the need for dedicated query languages, and surfaced through standard BI tools like {PowerBI, Tableau, QLik view}.
Those interested in data-lineage will note that the Butterfly effect is exactly the view that regulators want for BCBS239:
- What is the market-data sources for each line of a regulatory report (and are there duplicates)
- What source systems capture the trades (and which systems are not included)