Use Case OLAP
OLAP
On-Line Analytical Processing OLAP Is a perspective on data that accentuates analysis by viewing information as a cube that has a number of dimensions with each cube containing measures sourced from facts. OLAP Cubes allowed summary views to be aggregated a the highest level, and then drilled down to detail either through the hierarchy or to other dimensions. When the concept emerged, the idea was that each night you could extract facts (transactions) and compute the aggregate summaries for view on-line.
Early implementaitons calculated every possible aggregate value overnight and stored them in memory (MOLAP), so that on-line queries would be quick. With complex hierarchies the number of observations ballooned quicky because the dimensions {a,b} {1,2} needed summaries {a,b,1,2,a1,a2,b1,b2}. With faster computers, it became possible to avoid calculating every value, with some solutions converting Cube quieries into SQL aggregate queries of the source relational data.
Today analysis tools like Power BI, Talbeau, Qlik view and Excel Pivot Tables. all perform OLAP operations in memory.
All take the view that if you're interested in History, you add a time dimension and load the underlying facts into a Data-Warehouse, and query that rather than the source data. Where the underlying database supports time-travel temporal version history, the feature can be used instead of an additional data warehouse but is not commonly used because of poor performance.
Sample problem
Domain
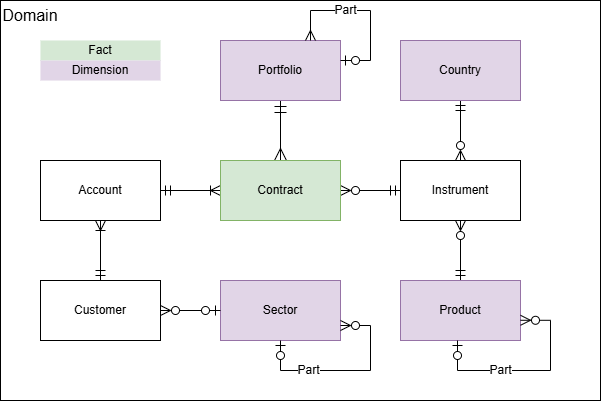
The data-model above is a simple case where
- Contract is a cube fact with references to the account, instrument and portfolio that it is booked too.
- {Portfolio, Sector, Product} are hierarchical dimensions and country is a dimension
- {Account, Instrument, Customer} are relations, but not interesting for analysis (often for client confidentiality)
Contracts can change over time; Instrument prices may change by the second and hierarchies of can be altered to meet changing business needs
Cube
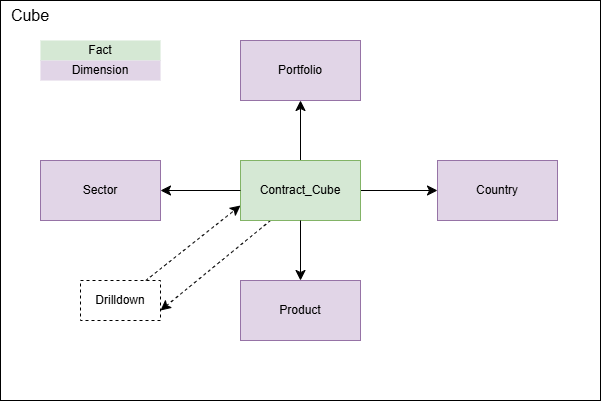
When viewed as a cube details are hidden, and it is possible to view total value of all contracts at the highest level of portfolio with drill-down to child portfolios or viewed as a cross-tab of { {Portfolio / Product} {Portfolio / Sector}, {Portfolio / Country}, {Portfolio / Time} } with totals for the intersections (and further drill-down to other pages).
As cube retains history and delta’s can be continuously refreshed, cube can drilldown to the events in hiperspace that triggered the change.
Hiperspace
The HiLang compiler will generate the data structure for Cube Models using:
- @CubeDimension property to mark dimensions elements of a cube
- @CubeFact property to map fact elements to additional cube elements
- @CubeMeasure property to map keys, values and extension as measures of the cube. The property has a parameter to highlight which aggregation function to use for summaries.
In addition to creating the _Cube Element (Contract_Cube in this example:
- References are added to each of the dimension elements ({Portfolio, Country, Sector, Product} each receive a reference to the cube element e.g.
Product' aquires aContract_Cube` extension for the summary accross all dimensions for this elment) - Each fact element aquires a
_Dimensionreference that provides an alias for the dimension path (e.g.Contractaquires an extensionSector_Dimension => this.Account?.Customer?.Sectorfor each dimension)
For the HiLang schema
@CubeDimension, CubeHierarchy(Parent), Versioned
entity Portfolio (Id : String) { Parent : Portfolio} [Children : Portfolio (Parent = this)];

@CubeDimension
entity Country (ISO : String) [Instruments : Instrument (Country = this)];

@CubeDimension, CubeHierarchy(Parent), Versioned
entity Sector (Id : Int32) { Parent : Sector } [Children : Sector (Parent = this), Customers : Customer (Sector = this)];

@CubeDimension, CubeHierarchy(Parent), Versioned
entity Product (Id : String) { Parent : Product } [Children : Product (Parent = this), ProductInstruments : Instrument (Product = this)];
entity Account (Id : String) {Customer : Customer};
entity Customer (Id : String) {Sector : Sector} [Accounts : Account (Customer = this) ];
entity Instrument (ISIN : String) {Country : Country, Product : Product} [Price : Price, Market = Price.Market];

@DeltaIndex, Versioned
aspect Price { Market : Decimal };

@CubeFact, DeltaIndex
entity Contract : Versioned
	(id : Int64)
	{Quantity : Decimal, Instrument : Instrument, Portfolio : Portfolio, Account : Account}
	[
		Market = Instrument.Market,
		@CubeMeasure(Aggregate.Sum)
		Value = Quantity * Market
	];
Contract_Cube is created with references to every dimension that can be uniquly linked to the fact. Contract_Cube aquires the properties
| Key | │ | Name | │ | Note |
|---|---|---|---|---|
| √ | │ | CubeSlice | │ | Identifier of the type cube observation |
| √ | │ | ContextLabel | │ | The Context Label the SubSpace was opened with - to aggregate domain view that filter content |
| √ | │ | Sector | │ | Reference to the Sector dimension |
| √ | │ | Country | │ | Reference to the Country dimension |
| √ | │ | Product | │ | Reference to the Product dimension |
| √ | │ | Portfolio | │ | Reference to the Country Portfolio |
| │ | AsAt | │ | Timestamp of this stored cube | |
| │ | Value | │ | The aggregated value of the Contract calculated extension Value = Quantity * Market |
|
| │ | IsFact | │ | Whether this is a base fact based observation or an aggregate summary | |
| │ | Deleted | │ | Flag to filter historical data, no longer relevant | |
| │ | Facts | │ | Count of facts that contributed to this observation | |
| │ | Sector_DrillDown | │ | Drilldown links to cubes that are either children of the sector hierarchy, or Cubes that extend the current cube to drill-down to include this dimension | |
| │ | Country_DrillDown | │ | Drilldown links to cubes that are either children of the country hierarchy, or Cubes that extend the current cube to drill-down to include this dimension | |
| │ | Product_DrillDown | │ | Drilldown links to cubes that are either children of the product hierarchy, or Cubes that extend the current cube to drill-down to include this dimension | |
| │ | Portfolio_DrillDown | │ | Drilldown links to cubes that are either children of the portfolio hierarchy, or Cubes that extend the current cube to drill-down to include this dimension |
Graph
If any of the dimensions provides a Node graph view, the cube also provides a Node view (with TypeName "Cube") and Edge view to traverse from the Dimension to the Cube summary, and from the Summary cube to the dimension. Each cube has a DrillDown edge to navigate to the down cube-hierarchy to all dimnensions
Hiperspace.DB
Hiperspace.DB automatically aggregates the cube summaries for all Hiperspaces hosted within in it, with the schedule
| Type | │ | When | │ | Trigger | │ | Notes |
|---|---|---|---|---|---|---|
| Full | │ | Often Daily | │ | Scheduled | │ | reaggregates the base level of Cube fact |
| Delta | │ | Continuous | │ | Whenever a fact changes | │ | aggregates the facts and summaries affected by the change to the fact, but no others |
| Dependency | │ | Continuous | │ | Whenever a @DeltaIndex element references by a fact changes |
│ | aggregates the facts and summaries affected by the change to a fact dependency, but no others |
| Related | │ | Frequently | │ | Whenever a @DeltaIndex element related is some way to fact changes |
│ | aggregates the facts and summaries affected by the change, but no others |
| Dimension | │ | Frequently | │ | Change to a dimension with a @DeltaIndex changes |
│ | Clears any summaries that might now be invalid due to restructure |
| │ | as needed | │ | read | │ | Any summaries that are not currently stored are recalculated from base facts |
Cube analytics is a USP for Hiperspace because
- Related elements are lazy loaded transparently when needed
- Recalculation of only the elements that have changed is possible because a
SubSpacecan be opened at any point-in-time to calculate a stable delta regardless of calculation complexity - Each versioned element (including cube) has a
GetVersions()function to retrieve the entire history of the element for relative analysis, and a time dimension without the need for a data-warehouse - The combination of Cube summaries with Graph view is not available in other tools (unless you pour the summaries into a specialist Graph database, and don't need up-to-date values)